Secular Variation and Calibration
A record of how the Earth's magnetic field has changed over time is required to calibrate the measured information from an archaeomagnetic sample into a calendar date. It was first realised that the direction of the Earth's field changes with time in the 16th century, since which time scientists (beginning with Henry Gellibrand) have periodically made observations of the changes in both the declination and inclination at magnetic observatories.
The record of how the Earth's magnetic field has changed is referred to as a secular variation curve. The British secular variation curve is based on the observatory data as well as direct measurements from archaeological materials. The Earth's magnetic field is a complicated phenomenon and so it is necessary to develop regional records of secular variation. The regional curves are centred on specific locations; for the UK the central point is located at Meriden (Latitude 52.43°N, Longitude 1.62°W), the village located at the notional centre of England.
Secular variation curves are constantly evolving as new data becomes available. The more information there is, the better we will understand how the Earth's magnetic field has changed over time, which may allow more precise archaeomagnetic dates to be produced. A number of secular variation curves have been produced for Britain over the last 50 years, reflecting the inclusion of additional information as well as improved methods used to construct the curves. The main secular variation curves have been summarised in this section in chronological order of their development. They include:
- Aitken, Hawley and Weaver (1963)
- Aitken (1970)
- Clark, Tarling, and Noel (1988)
- Tarling and Dobson (1995)
- Batt (1997; 1998)
- Zananiri, Batt, Lanos, Tarling, and Linford (2007)
- Korte and Constable: Continuous Archaeomagnetic and Lake Sediment data for the last 7000 years (CALS7K)
- Current work: the 'Magnetic moments in the past' project (2009)
The data used to construct the curves will be discussed as well as the relative merits/criticisms that have been noted since they were published.
The precision available for archaeomagnetic dates calibrated using the RenCurve calibration curves will then be presented for the different periods of time.
Aitken, Hawley and Weaver (1963)
The first secular variation curve was produced by Aitken and Weaver in 1962, published in the Archaeometry journal (volume 5: 4-19). It presented the observatory data of the Earth's magnetic field from the beginning of the 16th century AD, collated by Bauer (1899), and the measurements of 63 features collected from sites dating from the 1st millennium AD. This was updated a year later by Aitken, Hawley and Weaver (1963, Archaeometry 6: 76-81), with an additional 9 new features added. There were gaps in the data between AD400-800, which was partly due to the limited number of features sampled from this period of time.
Two secular variation curves were produced: one for the changes in declination and one for the changes in inclination over time. The individual measurements used to construct the curve were included on the graph as well as an indication of the relative precision of the measured information through the use of error bars. Only the more precise measurements were used; the less precise information was excluded. A trend line was drawn by hand through the data points, plotting the changes in the direction of the Earth's magnetic field over time. The dashed portions of the line indicate where the trend line was determined from the measured data, while the solid line was derived from the information compiled by Bauer (1899).
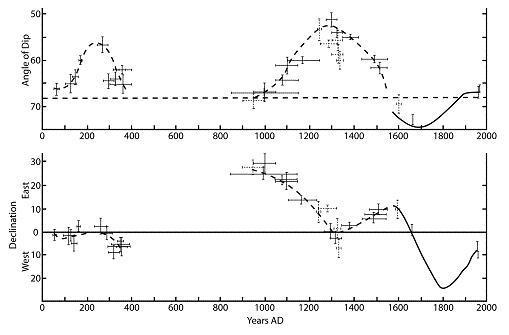
(Image redrawn from Aitken et al. (1963) by D. Bashford).
Aitken (1970)
In 1970 Aitken published the British secular variation curve in a new format, plotting a single curve of declination versus inclination. The curve included new data, presented within the Archaeometry journal by Aitken and Hawley (1966 & 1967) and represented 70 new features collected from sites dating from the pre-Roman to the Post-Medieval periods. Some periods of the curve still lacked enough information to permit a continuous curve to be produced, instead two separate segments covered the periods from AD1000-1950 and AD50-350. The dashed portion of the line indicates where the trend line was determined from measurements made on archaeological features rather than direct observations.
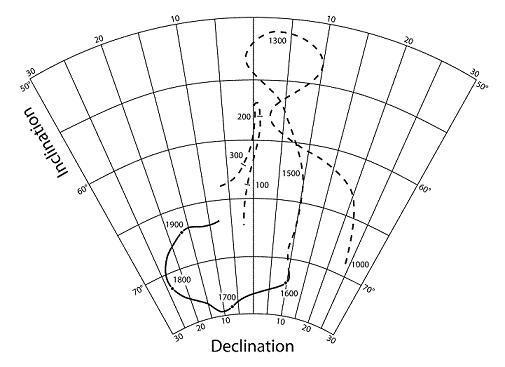
(Image redrawn from Aitken (1970) by D. Bashford).
Clark, Tarling and Noel (1988)
Clark, Tarling and Noel (1988) presented an updated secular variation curve in the Journal of Archaeological Science (volume 15: 645-667). The curve was based on observatory data (Bauer 1899), and 92 of the best direct measurements of archaeological remains. Information obtained from sediments collected from three British lakes (Turner and Thompson 1982) was also included for periods of time where the data were sparse, such as the 1st millennium BC. This allowed the relative rates and directions of change within the Earth's magnetic field to be assessed from the sediments. It also suggested the general form that the secular variation curve should take for the periods of time where little information was available.
A single curve was produced that presented the data as a plot of declination versus inclination. The curve has been divided into 100 year blocks of time back to 1000BC.
The Clark curve has been criticised in recent years for a number of reasons (Batt 1997):
- The curve was drawn by hand through the data points
- The errors associated with the curve were not represented, and so the reliability of the information could not be assessed
- The accuracy of the measured data points was not considered
- The methods used to assign the archaeological date to the sampled features were not described
- The accuracy of the archaeological dates assigned to the sampled features was not stated
- The area of the curve covering the 1st millennium BC was based on only limited amounts of high quality information, and was largely based on the information collected from the three British lake sediment sequences
Despite the criticisms, the Clark curve has been used as the primary method of calibration for archaeomagnetic dating.
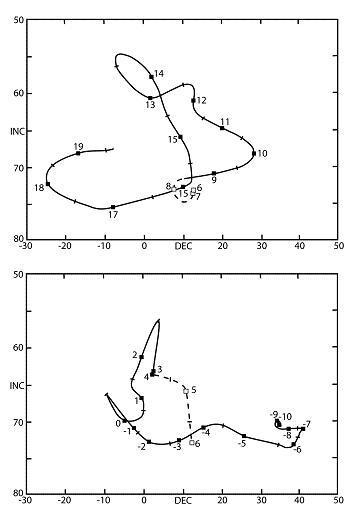
(Image redrawn from Clark et al. (1988) by D. Bashford).
Tarling and Dobson (1995)
In 1995 an updated calibration curve was developed by Tarling and Dobson, published in Journal of Geomagnetism and Geoelectricity (volume 47: 5-18). The curve was based on 172 magnetic directions, but the lake sediment data from the three British lakes (Turner and Thompson 1982) were excluded as there was a discrepancy noted between measurements from archaeological deposits and the lake sediment data of the same apparent age. The secular variation data were presented as a single plot of declination versus inclination. An assessment of the error associated with the curve was presented as a shaded area around the trend line (Tarling and Dobson 1995). This represented the first attempt to evaluate the sources of uncertainty associated with the calibration data that needed to be taken into account when constructing a calibration curve. Despite this, the Clark et al. (1988) curve remained the primary method of calibrating archaeomagnetic data in the UK.
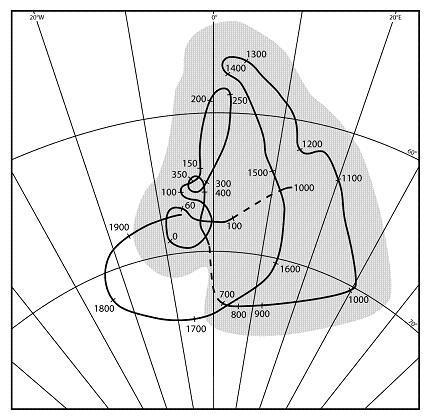
(Image redrawn from Tarling and Dobson (1995) by D. Bashford).
Batt (1997, 1998)
In 1997 Batt reassessed the British calibration curve by defining the trend line of change in the Earth's magnetic field using a statistical model (published in Archaeometry, volume 39(1): 153-168). No new data were added, instead representing the first attempt to apply an entirely automated objective algorithm to the problem of drawing a continuous curve through the UK archaeomagnetic data. This was weighted towards the more precise data, and the errors associated with the curve were represented as an envelope around the trend line. The data were presented as a single plot of declination versus inclination. As a result of this approach, it was not possible to reproduce the 'Roman hairpin', or the part of the curve between 300-1000BC noted in the Clark et al. (1988) curve. However, the Clark et al. (1988) calibration curve remained the primary method of calibrating archaeomagnetic data in the UK.
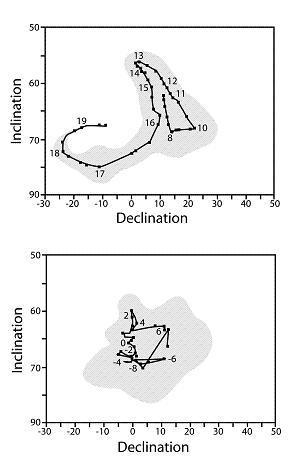
(Image redrawn from Batt (1998) by D. Bashford).
Zananiri, Batt, Lanos, Tarling and Linford (2007)
In 2007 an updated method was presented by Zananiri et al. (2007) to construct secular variation curves (published in Physics of the Earth and Planetary Interiors, volume 160: 97-107).The curve was based on 620 magnetic directions and was constructed using a new statistical method that utilised a Bayesian approach. An assessment of the error assigned to each period of time was also produced as an envelope around the curve, resulting in an objective calibration curve. The secular variation curve was plotted using the RenCurve programme developed by Phillipe Lanos (published in Buck & Millard (2004) Tools for constructing chronologies, pages 43-82), with separate secular variation curves produced for the changes in declination and inclination.
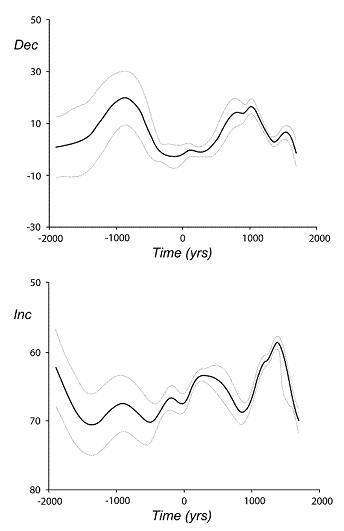
(Image redrawn from Zananiri et al. (2007) by D. Bashford).
Korte and Constable (2005): CALS7K
The British secular variation curve currently extends back to 1000BC. For features dating to older periods, it is possible to produce an estimated date using the current global model of the geomagnetic field. This was produced by Korte and Constable (2005) and is referred to as the 'continuous archaeomagnetic and lake sediment data for the last 7000 years' (CALS7K.2), published in Geochemistry, Geophysics and Geosystems (volume 6(1): 1-18). It is composed of archaeomagnetic and palaeomagnetic information from locations across the world, and includes over 13,000 directional measurements, and 3188 measurements of the intensity of the geomagnetic field (Korte and Constable 2005: 3). The secular variation curves were constructed statistically for the three components (declination, inclination and intensity), resulting in three separate curves covering the time period 5000BC-AD1950. An assessment of the errors assigned to each individual measurement was taken into account in the construction of the curves, as well as the uncertainties associated with the independent dates assigned to each feature.
It is important to note that the CALS7K secular variation curves effectively represent smoothed averages of the data collected from around the world; some of the resolution available from the regionally specific curves will be lost, which in turn would affect the resolution of the calibrated age ranges. However, until the British secular variation curve can be extended it is the best method of obtaining age estimates for the periods pre-1000BC. This approach has been used to infer a date for a Bronze Age hearth at Ringlemere Farm (Linford and Martin 2008).
Current work: the 'Magnetic Moments in the Past' project
Recent work has focused on the development of a suitable database to store archaeomagnetic information in a manner that will allow the secular variation curves to be regularly updated. This work has been carried out as part of the 'Magnetic Moments in the Past' project funded though an AHRC Knowledge Transfer Fellowship (Project No. AH/G01020X/1). This will allow continued improvement of the calibration curves, as well as highlighting aspects that need to be developed further. The database currently holds information on 765 archaeomagnetic studies from 376 sites (figures correct as of February 2010).
Precision of an archaeomagnetic date
It is difficult to state an average precision that can be expected from an archaeomagnetic date as the Earth's magnetic field changes at varying rates through time. In periods where the change in direction was rapid, it may be possible to produce a more precise age range, but in the periods where the changes are slower a larger age range may be produced.
A related issue is that, unfortunately, during the last few millennia the Earth's magnetic poles appear at times to have reoccupied the same position on more than one occasion (for instance during the first centuries BC and AD). This can cause ambiguity as more than one date range is then possible and independent evidence is require to determine which is correct.
The precisions likely to be achieved for archaeomagnetic dates calibrated with the RenCurve (Lanos 2004) calibration curves have been summarised in this section for different periods of time.
| Period | Speed of change in the Earth's magnetic field | Approximate precision available (at 95% confidence levels) |
|---|---|---|
| Post-Medieval (AD1540-present) | Rapid | 25 years, but possibly 10 years after AD1700 |
| Medieval (AD1066-1540) | Rapid | 100-150 years |
| Early Medieval (AD410-1066) | Slow between AD400-850 and then more rapid changes in declination | 100-200 years |
| Roman (AD43-410) | Slow change in inclination between AD100-250, and the field doubles-back at AD250 | 200-300 years |
| Iron Age (700BC-AD43) | Rapid change in declination, inclination remains relatively constant. The field reverses in direction around 50BC causing a 'loop' in the 1st century BC | 300-400 years |
| Bronze Age (2500-700BC) | Very slow | 200-300 years |
